The sales reports that matter most for a team working Meta ad and WhatsApp leads answer five questions: how fast do we reply, how many leads do we actually reach, how many become meetings and customers, which sources make money, and who on the team is converting. The core sales KPIs behind them are first response time, contact rate, lead-to-meeting rate, conversion by source, cost per customer, ROAS, pipeline velocity and a salesperson leaderboard.
Each KPI below comes with a formula and a note on how to read it. Then we work through one illustrative month for a clinic so you can see the numbers together, and finish with a reporting rhythm: what to check daily, weekly and monthly.
Why most sales reports do not help
Many small businesses have reports, but they are built by hand in Excel at the end of the month, every salesperson's numbers are counted differently, and they stop at "leads received" and "sales made". Everything in between, where leads are actually lost, is invisible.
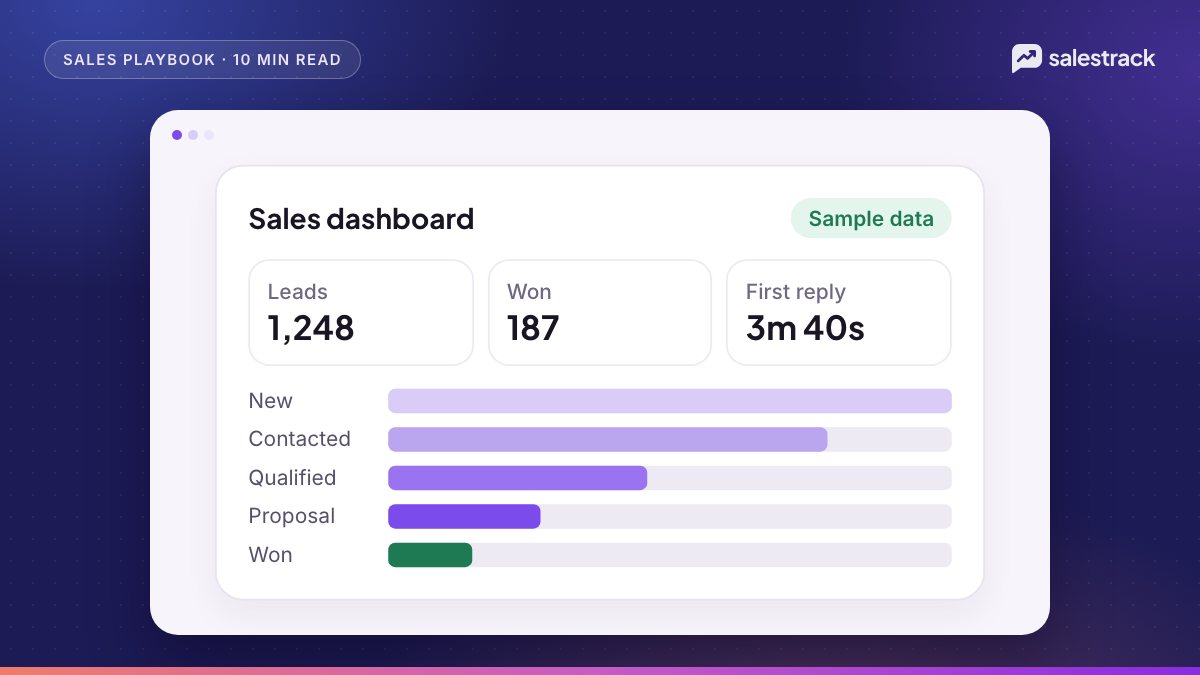
Good sales reports share three traits. They come from one system, so everyone sees the same number. They break each number down by source, person and branch. And they track the funnel step by step, so when sales drop you can see whether the problem is fewer leads, slower replies, fewer meetings or weaker closing.
Speed and reach KPIs
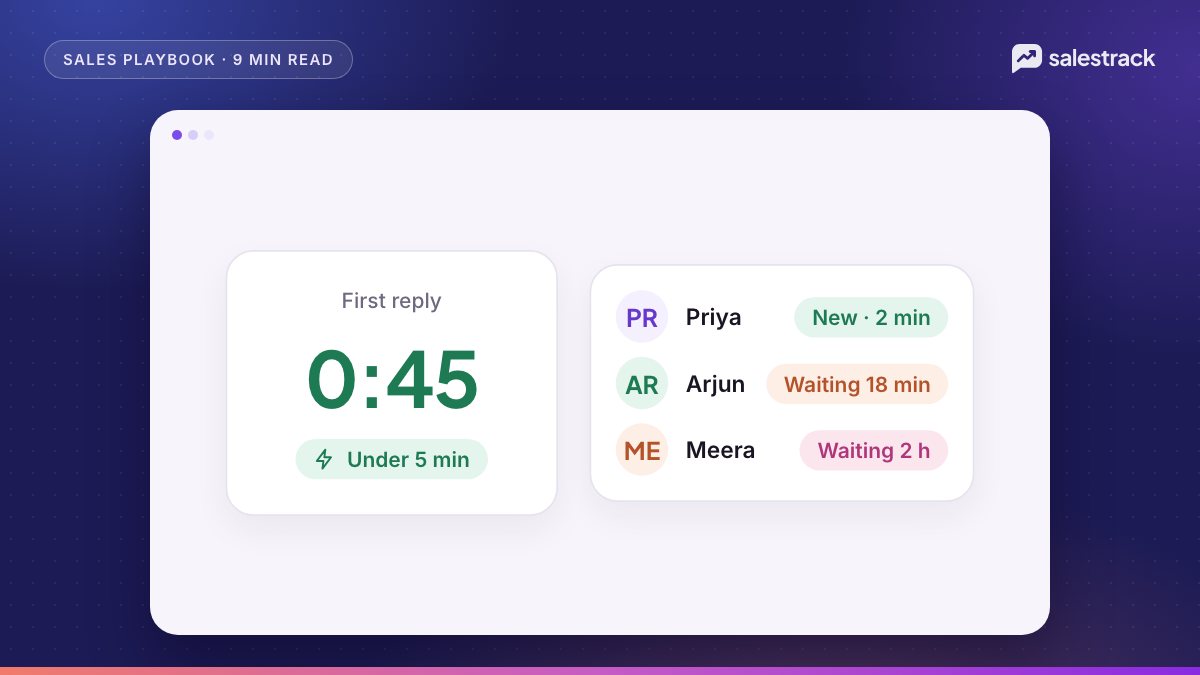
1. First response time
Formula: median of (time of first contact minus time lead was created), across all leads in the period. Also track the share answered within 5 minutes.
Use the median, not the average, and track both the first reply (including automatic) and the first human contact. Research gives a reason to care: a 2011 Harvard Business Review study found that firms contacting leads within an hour were nearly seven times as likely to qualify them as firms that waited an hour longer. See our full guide to speed to lead.
2. Contact rate
Formula: leads with at least one two-way conversation (a connected call or a WhatsApp reply) / total leads x 100.
If contact rate is low, the problem is usually speed, wrong numbers from a lead form, or giving up after one call. Split it by source: lead form leads often have a lower contact rate than Click-to-WhatsApp chats, because the person typed their number into a form instead of starting a chat.
3. Uncontacted leads
Formula: count of leads older than 24 hours with no human contact.
This should be close to zero. In the HBR audit of 2,241 US companies, 23% never responded to a test web lead at all. Put this number on the manager's screen every morning.
Funnel and conversion KPIs
4. Lead-to-meeting rate
Formula: leads that booked a meeting (consult, site visit, demo class, call with an expert) / total leads x 100.
This is the earliest signal of lead quality and salesperson skill, and you get it weeks before you know who bought.
5. Lead-to-customer conversion by source
Formula: leads from a source that became paying customers / total leads from that source x 100.
Always break this down by source, campaign and ideally ad. A campaign's conversion rate matters more than its lead volume.
6. Meeting-to-customer rate (win rate)
Formula: customers / meetings held x 100.
A low lead-to-meeting rate is a marketing or first-contact problem. A low meeting-to-customer rate is a sales, pricing or offer problem. Separating the two stops arguments between marketing and sales.
Money KPIs: cost per customer and ROAS
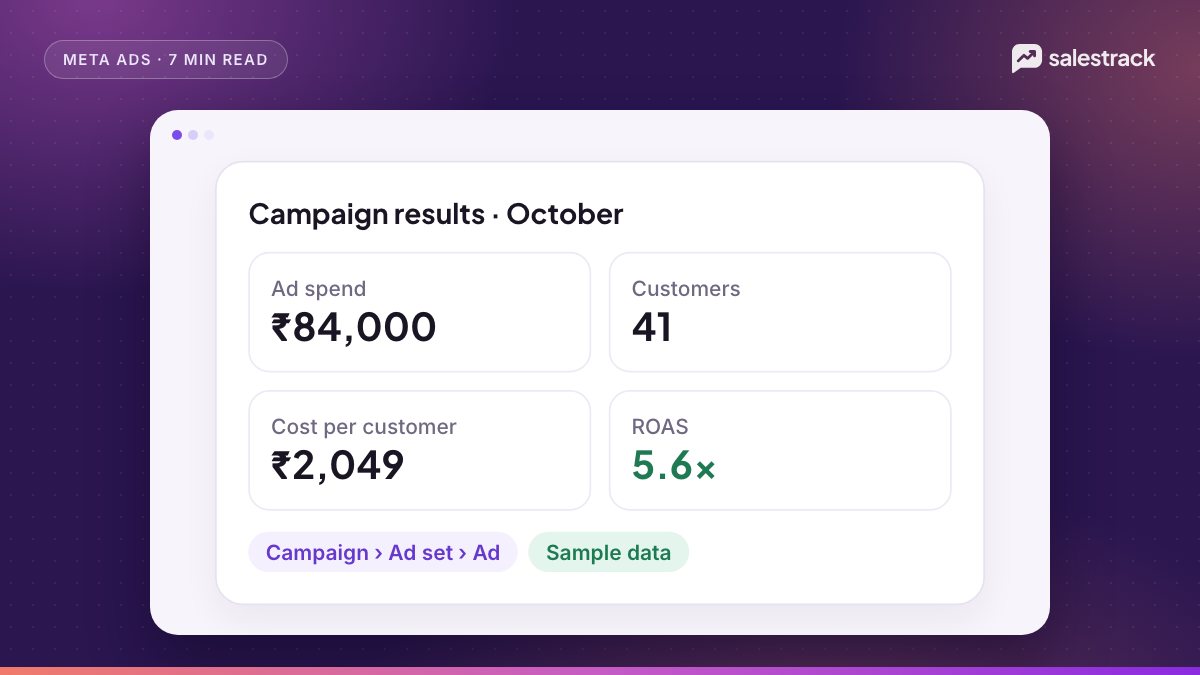
7. Cost per customer
Formula: ad spend for a source or campaign / customers won from it.
Cost per lead tells you how cheap enquiries are. Cost per customer tells you how expensive buyers are, which is what you pay salaries and rent with.
8. ROAS (return on ad spend)
Formula: revenue from customers won from a campaign / ad spend on that campaign.
A ROAS of 5x means every rupee or dirham spent returned five in revenue. Whether that is good depends on your margin: if your gross margin is 40%, break-even ROAS is 1 / 0.40 = 2.5x. Getting accurate cost per customer and ROAS needs the ad ID on every lead; our guide to tracking cost per customer and ROAS from Meta ads explains how.
9. Pipeline velocity
Formula: (open opportunities x win rate x average deal value) / average sales cycle in days.
Pipeline velocity is the revenue your pipeline produces per day. It rises when you have more qualified opportunities, win more of them, sell bigger deals or close faster. It is most useful as a trend month on month.
A worked example: one month at a clinic
For example, a dental clinic in India with three lead sources might see this in one month. All numbers are illustrative.
| Metric | Meta lead forms | Click-to-WhatsApp | Website and organic | Total |
|---|---|---|---|---|
| Ad spend | ₹60,000 | ₹40,000 | ₹0 | ₹1,00,000 |
| Leads | 400 | 200 | 50 | 650 |
| Contacted (contact rate) | 300 (75%) | 180 (90%) | 45 (90%) | 525 (80.8%) |
| Consults booked (lead-to-meeting) | 80 (20%) | 60 (30%) | 20 (40%) | 160 (24.6%) |
| Patients won (conversion) | 24 (6%) | 20 (10%) | 10 (20%) | 54 (8.3%) |
| Revenue | ₹7,20,000 | ₹6,00,000 | ₹3,00,000 | ₹16,20,000 |
| Cost per lead | ₹150 | ₹200 | — | ₹167 (paid) |
| Cost per customer | ₹2,500 | ₹2,000 | — | ₹2,273 (paid) |
| ROAS | 12.0x | 15.0x | — | 13.2x (paid) |
What this tells the manager:
- Click-to-WhatsApp leads cost more per lead but less per customer. At ₹200 versus ₹150 per lead, they look worse in Ads Manager. At ₹2,000 versus ₹2,500 per patient, they are the better buy.
- Lead form contact rate is the leak. One in four lead form leads is never reached. Faster first replies and a better first template would likely add more patients than extra spend.
- Pipeline velocity. With 60 consults booked but not yet decided, a win rate of 34% (54 / 160, rounded), an average treatment value of ₹30,000 (₹16,20,000 / 54) and a 20-day average cycle: 60 x 0.34 x ₹30,000 / 20 = about ₹30,600 of revenue per day in the pipeline.
The salesperson leaderboard
A leaderboard shows the same KPIs per person. Keep it to a few columns so it drives coaching, not arguments. Illustrative example:
| Salesperson | Leads owned | Median first contact | Contact rate | Meetings | Won | Won value |
|---|---|---|---|---|---|---|
| Divya | 180 | 3 min | 88% | 52 | 19 | ₹5,70,000 |
| Rahul | 170 | 6 min | 82% | 44 | 15 | ₹4,50,000 |
| Sara | 160 | 14 min | 76% | 38 | 12 | ₹3,60,000 |
| Nikhil | 140 | 41 min | 71% | 26 | 8 | ₹2,40,000 |
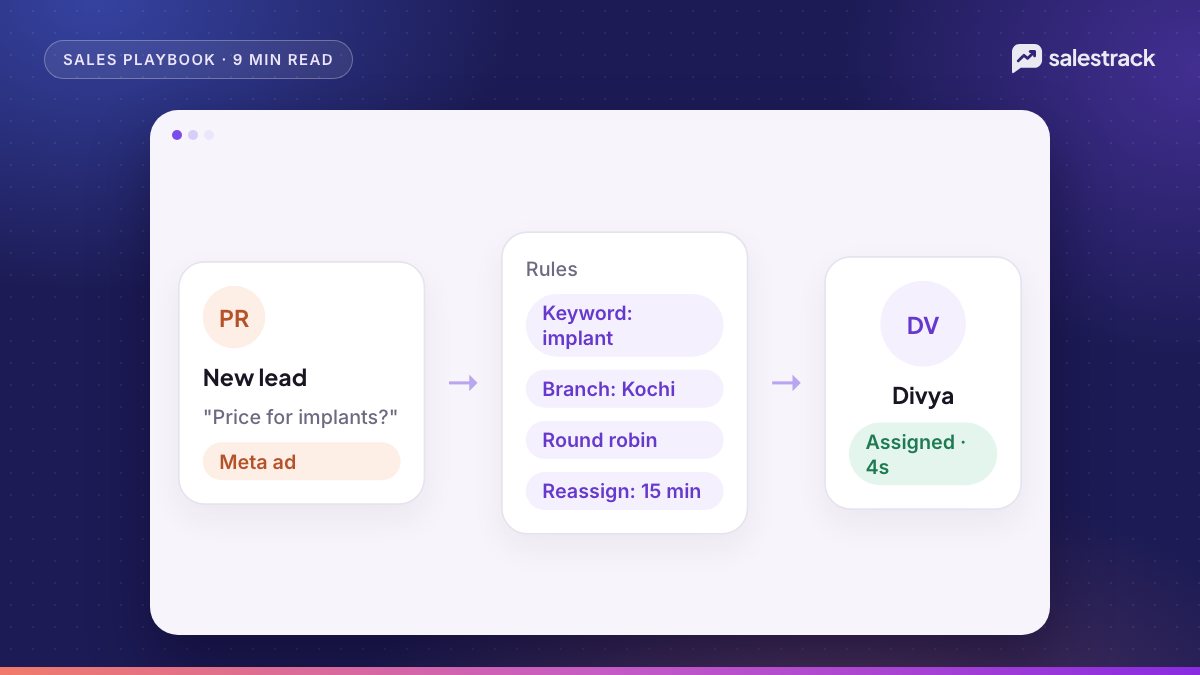
Read across, not just down the "won" column. Nikhil's problem is speed: a 41-minute median first contact and the lowest contact rate. Fix that before discussing his closing. Make sure leads are shared fairly first; our lead assignment rules guide covers round robin and workload caps.
How often to check each sales report
| When | Reports | Action |
|---|---|---|
| Daily (5 minutes) | Uncontacted leads, first response time, overdue follow-ups | Reassign, nudge, fix staffing gaps |
| Weekly (30 minutes) | Contact rate, lead-to-meeting, leaderboard, stuck deals | Coach one or two people, clear stuck deals |
| Monthly (1 hour) | Conversion by source, cost per customer, ROAS, pipeline velocity, lost reasons | Move ad budget, change offers and scripts |
Sales reports in salestrack
salestrack ships 20 built-in reports, including business overview, funnel, stage time, stuck leads, lost reasons, response time, workload, branch comparison and marketing ROI, with a "Start here" view for owners, managers and salespeople. Every report filters by date, branch, team, source and campaign, and you can click any number to see the leads behind it. Meta ads ROI shows cost per customer and ROAS by campaign, ad set and ad, and team scorecards show median first reply, conversion and won value per person. Core reports are free; all 20 are on Starter and Growth.
FAQ
What are the most important sales KPIs?
For teams working ad leads: first response time, contact rate, lead-to-meeting rate, lead-to-customer conversion by source, cost per customer, ROAS and pipeline velocity, plus a per-salesperson view of the same numbers.
What is the difference between a sales report and a KPI?
A KPI is a single number you track against a target, such as median first response time. A sales report groups several numbers, usually broken down by source, person, branch or period, so you can see why a KPI moved.
How do you calculate pipeline velocity?
Pipeline velocity = (number of open opportunities x win rate x average deal value) / average sales cycle length in days. The result is the revenue your pipeline produces per day.
How often should a sales manager review reports?
Response time and uncontacted leads daily, conversion and leaderboard weekly, and cost per customer, ROAS and pipeline velocity monthly, since those need enough closed deals to be meaningful.
Why is cost per customer better than cost per lead?
Cost per lead counts enquiries, not buyers. A campaign with cheap leads that rarely convert can cost more per customer than a campaign with expensive leads that convert well.
Sources
Facts in this article were checked against these sources on 1 November 2026. WhatsApp and Meta change their rules and prices often, so check the source before you rely on a number.